Connection Quality Monitor Online User Manual
Introduction
SoftPerfect Connection Quality Monitor is a professional monitoring solution designed to track the health and performance of Internet connections across one or multiple locations. It continuously evaluates and monitors three critical aspects of your Internet service:
- Connection quality – monitors ping times, jitter, and packet loss to assess connection stability and reliability.
- Connection speed – regularly tests and records upload and download speeds to verify your ISP delivers the promised bandwidth.
- Uptime – detects and logs all periods when your Internet connection goes offline to gather records of service interruptions.
All collected data is presented in intuitive charts and can be exported for reporting or analysis, making it easier to spot intermittent issues, verify service level agreements, and hold your ISP accountable for poor performance.
Key benefits
With Connection Quality Monitor you can get valuable benefits for various scenarios:
- Verify ISP performance: get concrete evidence when your Internet service provider fails to deliver the promised speeds, or experiences frequent dropouts. Export historical data to support your complaints or refund requests.
- Monitor multiple locations: perfect for businesses with branch offices, remote sites, or distributed infrastructure. Monitor all locations from a single management console on your workstation.
- SLA compliance: document connection reliability and performance metrics to verify that the service level agreements are being met. Maintain historical records for auditing purposes.
- Proactive problem detection: automated alerts notify you immediately when connection quality degrades, speed drops below thresholds, or downtime exceeds acceptable limits.
- Trend analysis: identify patterns in connection performance over time. Determine if issues occur at specific times of day, days of the week, or correlate with other events.
- Remote site management: for IT professionals managing geographically distributed networks, Connection Quality Monitor provides centralised visibility into connection health at all sites without needing to visit each location.
Architecture overview
Connection Quality Monitor uses a distributed client-server architecture consisting of two components that work together:
The monitoring service
This is a Windows service that runs continuously in the background, even when no user is logged in. The service performs the actual monitoring work:
- Executes periodic ping tests to highly-available servers (Cloudflare, Google, and Quad9 DNS) to measure connection latency, jitter, and packet loss.
- Performs scheduled speed tests by uploading and downloading data to measure actual bandwidth.
- Records all metrics to a local SQLite database for historical tracking.
- Evaluates alert conditions and sends notifications when thresholds are breached.
- Provides connection to port 8703 for remote management via graphical user interface.
The service stores all collected data in %ProgramData%\SoftPerfect\Connection Quality Monitor\, ensuring data persists across reboots and user sessions. You can install as many monitoring services as your licence type permits.
The management console
This is the graphical user interface application that provides visibility and control:
- Connects to one or more monitoring services (local or remote) to retrieve collected data.
- Displays device status, current metrics, and historical trends in an organised tree view.
- Presents speed, ping, and downtime information in interactive charts.
- Allows configuration of monitoring parameters, alerts, and device settings.
- Exports data in multiple formats (CSV, HTML, XML, JSON, TXT) for reporting and analysis.
The management console communicates with monitoring services using HTTP on port 8703. This allows you to monitor the local computer by connecting to localhost, as well as monitor remote computers across your network from a single workstation by connecting to their hostname or IP address.
This architecture enables powerful distributed monitoring scenarios. For example, you can:
- Install the monitoring service on computers at each branch office or remote site.
- Install the management console on your IT administrator workstation.
- Connect the console to all remote services to view the connection quality at every location from one centralised dashboard.
- Configure alerts to notify you of problems at any monitored site.
Each monitoring service operates independently, collecting data continuously even if the management console is not connected. This ensures no data is lost and provides a complete historical record. The number of management consoles is not limited by the licence type.
Use cases
ISP performance verification
If you suspect your Internet service provider is not delivering the speeds you're paying for, or if you experience frequent dropouts, Connection Quality Monitor provides concrete evidence. Run it for a few days or weeks to collect data, then review the charts and export reports showing actual versus promised performance. This data can support complaints, refund requests, or decisions to switch providers.
Multi-site business monitoring
Organisations with multiple offices, retail locations, or remote sites can install the monitoring service at each location and manage them all from a central workstation. This provides instant visibility into connection problems at any site, allowing IT staff to proactively address issues or document problems for the local ISP.
Work-from-home support
IT departments supporting remote workers can install Connection Quality Monitor at employees' home locations (with permission) to diagnose connection issues that affect productivity, video conferencing quality, or VPN reliability.
SLA documentation and compliance
If you have a service level agreement with your ISP specifying uptime guarantees or minimum bandwidth, Connection Quality Monitor provides the historical data needed to verify compliance. Export monthly reports showing actual uptime percentages and speed measurements for contract reviews or dispute resolution.
Network troubleshooting
When users say “the Internet is slow”, it is often unclear whether the problem is the Internet connection, the local network, or specific applications. Connection Quality Monitor isolates the Internet connection component by measuring performance to well-known external servers, helping narrow down the root cause.
Data centre and hosting monitoring
Hosting providers, data centres, and cloud service operators can use Connection Quality Monitor to verify the Internet connectivity they provide to customers. Deploy it alongside hosted services to demonstrate connection quality and quickly identify when issues arise.
Getting started
Installation
The Connection Quality Monitor installer includes two components. During installation, you can choose to install both or just one:
- Monitoring Service – the background service that performs monitoring. Install on each computer or location you want to monitor.
- Management Console (GUI) – the graphical application for viewing data and managing settings. Install on any computer where you want to view the monitoring results.
For a single-computer installation, select both components. For distributed monitoring, install the Monitoring Service on remote computers, and the Management Console on your administrator workstation.
The installer will automatically start the monitoring service and configure the Windows firewall to allow connections on port 8703. You can choose whether the service starts automatically with Windows.
First launch
When you first launch the management console, you will see an empty device tree. To begin monitoring, you need to connect to a monitoring service.
If you installed both components on the same computer, the quickest way to get started is to connect to localhost. This will connect the console to the local monitoring service and begin displaying data as it gets collected.
Interface
The main window is organised into several key areas:
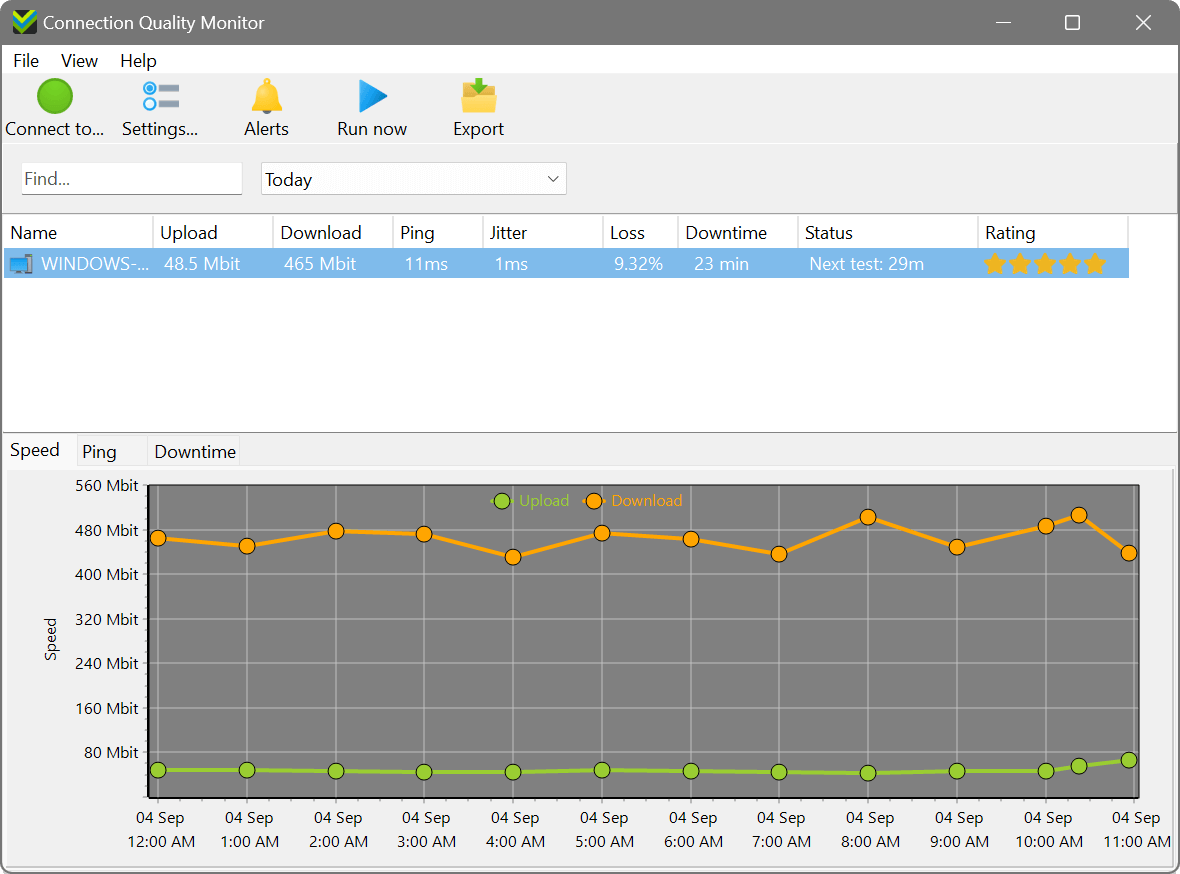
- Toolbar provides quick access buttons for common tasks: Connect, Settings (for each device), Alerts, Run Now (immediate test), and Export.
- Device Tree displays all connected devices with their current metrics in a sortable, multi-column view. You can see at a glance the upload/download speeds, ping times, jitter, connection quality percentage, uptime, and the time when the last measurement was taken.
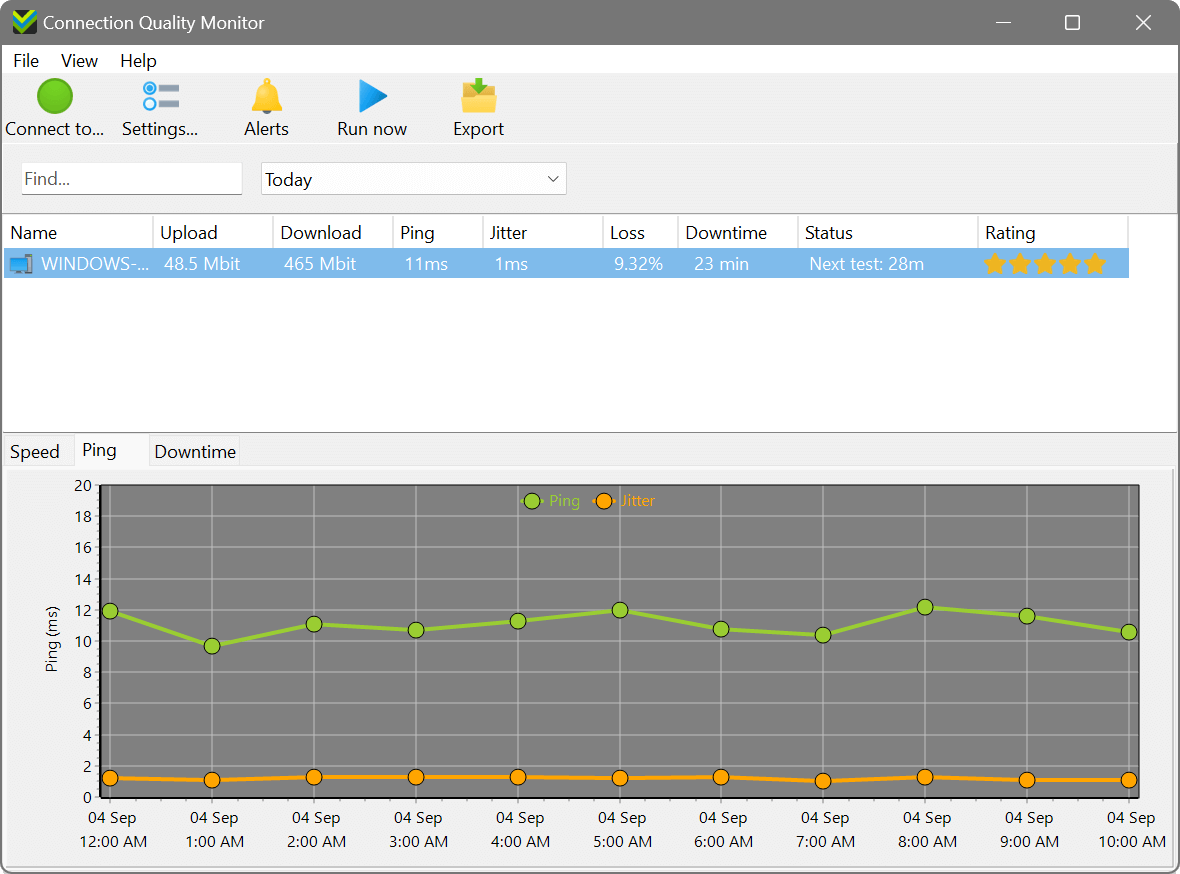
- Chart Tabs show different aspects of collected data:
- Speed – line chart showing upload and download speeds over time.
- Ping – line chart showing ping times and jitter over time.
- Downtime – list of all offline periods with start times and durations.
- Period Selector lets you choose which time period to display in the charts: Today, Yesterday, This Week, Last Week, This Month, or Last Month.
Connecting to a device
To monitor a location, click the Connect to... button in the toolbar or choose File – Connect to... from the menu. You will see the connection dialog where you can:
- Enter a hostname or IP address manually (for example, localhost, office.example.com, or 192.168.1.100).
- Click Find to use UDP broadcast discovery, which will automatically find any monitoring services running on your local network.
- Enter the password if the monitoring service is password-protected (recommended for remote installations).
Once connected, the device will appear in the device tree, and data collection will begin immediately if not already running.
Monitoring features
Speed testing
Connection Quality Monitor performs active speed tests by uploading and downloading data to remote servers. Be aware that speed tests consume bandwidth and count towards your data usage quotas. Tests upload and download up to 500 MB of data per test. Each test measures:
- Average upload speed – the sustained upload bandwidth during the test.
- Average download speed – the sustained download bandwidth during the test.
- Maximum speeds – the peak upload and download rates achieved during the test.
You can configure how often speed tests run (in minutes) for each monitored device. To manually trigger a speed test at any time, select a device and click the Run Now button in the toolbar.
Speed test results are displayed in the Speed chart tab, showing upload and download trends over time. This makes it easy to spot patterns, such as reduced speeds during peak hours or gradual degradation.
Ping and uptime monitoring
The monitoring service continuously pings well-known, highly-available DNS servers operated by Cloudflare (1.1.1.1), Google (8.8.8.8), and Quad9 (9.9.9.9). This provides a passive, low-bandwidth method to assess connection quality. For each ping test, the service records:
- Ping time – the round-trip time in milliseconds. Lower is better; typical values range from 10–50ms for broadband connections.
- Jitter – the variation in ping times. High jitter can cause problems for real-time applications like voice and video calls.
- Packet loss – the percentage of ping packets that don't receive a response. Any packet loss indicates a problem.
- Connection state – whether the connection is currently online or offline.
You can configure the ping interval (in milliseconds) for each monitored device. More frequent pings provide finer-grained data but generate more network traffic.
Ping statistics are displayed in the Ping chart tab, showing latency and jitter trends over time. A good quality connection will show low, consistent ping times with minimal jitter.
Downtime tracking
Whenever the monitoring service detects the Internet connection has gone offline (all ping tests fail), it records the start time. When connectivity is restored, it calculates the duration of the outage. All downtime events are logged to the database and displayed in the Downtime tab as a list showing:
- Start time – when the connection went offline.
- Duration – how long the connection was down (e.g., “2 minutes 34 seconds”).
This provides detailed evidence of connection reliability. You can export this data to demonstrate ISP problems or verify uptime SLAs.
Alerts and notifications
Connection Quality Monitor includes a flexible alert system that can notify you when connection quality degrades. You can create alerts based on:
- Upload speed below threshold triggers when upload speed falls below a specified value for a consecutive number of tests.
- Download speed below threshold triggers when download speed falls below a specified value for a consecutive number of tests.
- Ping time above threshold triggers when latency exceeds a specified value for a consecutive number of measurements.
- Connection downtime triggers when the connection has been offline for a specified duration.
Each alert can perform one or both of the following actions:
- Send an e-mail – integrates with SendGrid to send email alerts. Configure your SMTP settings and recipient addresses. To prevent alert fatigue, the system limits emails to a maximum of 10 per hour.
- Execute a command – runs a custom executable or script when the alert triggers. This allows integration with other monitoring systems, logging, or automated remediation.
To manage alerts, click the Alerts button in the toolbar. You can add, edit, enable/disable, or remove alerts. Each alert shows its current status and when it last triggered.
Data export and reporting
Connection Quality Monitor makes it easy to export collected data for reporting, analysis, or documentation purposes.
Viewing historical data
Use the period selector in the control panel to choose which time range to display in the charts: Today, Yesterday, This Week, Last Week, This Month, or Last Month. Charts update automatically when you change the period, allowing quick comparison of performance across different time ranges.
Exporting data
Click the Export button in the toolbar to export these types of data:
- Speed data – all upload and download measurements for the selected device and date range.
- Ping data – all ping time, jitter, and packet loss measurements.
- Downtime data – all recorded offline periods with start times and durations.
Choose from multiple export formats:
- CSV – comma-separated values, ideal for importing into spreadsheet applications like Excel.
- HTML – web page format for easy viewing in a browser.
- XML – structured format for integration with other systems.
- JSON – modern data format for web applications and APIs.
- TXT – plain text format for simple viewing or processing.
Exported data includes timestamps and all relevant metrics, providing a complete historical record suitable for reports, audits, or ISP complaints.
Device settings and customisation
Configuring device monitoring
Each monitored device can be configured independently. Select a device in the tree and click the Settings... button in the toolbar to adjust:
- Device name – assign a friendly name for easy identification (e.g., "Head Office", "Branch 3", "Home Connection").
- Access password – set or change the password required to connect to this monitoring service. This is essential for remote installations to prevent unauthorised access.
- Enable uptime monitoring – turn ping tests on or off for this device.
- Enable speed testing – turn speed tests on or off for this device.
- Ping interval – how often to perform ping tests, in milliseconds. Lower values provide more frequent data but generate more traffic.
- Speed test interval – how often to perform speed tests, in minutes. Consider bandwidth usage and data quotas when setting this value.
Changes are applied immediately to the monitoring service.
Application preferences
Choose File – Settings to access application-wide preferences. You can customise:
- Chart colours – choose the colours used for upload, download, ping, and jitter lines in the charts, as well as background and text colours. Several pre-defined colour schemes are available, or you can create your own custom palette.
- Column visibility – choose which columns to display in the device tree (Name, Upload, Download, Ping, Jitter, Quality, Uptime, Last Ping).
- Auto-start options – configure whether the management console starts automatically when you log in.
Managing multiple devices
You can connect to as many monitoring services as your licence permits. Each connected device appears in the device tree with its current status and metrics. Right-click any device to access additional options:
- Settings – opens the device settings dialog.
- Reconnect – disconnects and reconnects to refresh the connection.
- Rename – changes the device's friendly name.
- Remove – disconnects and removes the device from the tree.
- Reset – clears all collected data for this device (use with caution).
The device tree supports multi-column sorting. Click any column header to sort by that metric, making it easy to identify which locations have the slowest speeds, highest ping times, or lowest uptime.
End User Licence Agreement (EULA)
This software and the included documentation is copyright SoftPerfect Pty Ltd, Australia. All rights are reserved. The software may be used, installed or copied only in accordance with the terms of the licence described in the following paragraphs.
DISTRIBUTION TERMS
The evaluation version of the software may be freely distributed, provided that the original distribution package is not modified in any way.
EVALUATION VERSION
This is not free software. You are hereby licensed to use this software for evaluation purposes without charge. The evaluation version may be of a limited duration, or have some features limited or disabled. To use the software without these restrictions, you need to purchase a licence.
GRANT OF LICENCE
The software is licensed, not sold. Upon purchase of a licence, SoftPerfect grants you a non-exclusive, non-transferable right to use the software and all its features according to the terms of this EULA and the purchased licence type as described in the Licence Types section.
LICENCE TYPES
- Single Device Licence grants the purchaser, or agents of the purchaser, rights to install and use the software on one device only (e.g. computer, server, USB flash drive or virtual machine) at any given time. The licence can be reinstalled on the same device at any time, or deleted from one device and then moved to another. It can be used on any operating system compatible with the software. To install and use the software on more than one device simultaneously, you must purchase the corresponding number of single device licences or one of the special licences listed below.
- Multiple Licence Pack grants the purchaser, or agents of the purchaser, rights to simultaneously install and use the software on up to as many devices as is stipulated by the quantity in the pack. For example, the “Up to 10 Devices” pack allows installing and using the software on up to ten devices at the same time. Each device licence within the pack is identical to a single device licence. The licence pack can be used across multiple devices running different operating systems compatible with the software.
- Site Licence grants an organisation, or agents of an organisation, rights to install and use the software on an unlimited number of devices within one organisation site, including any cloud-based installation and use performed from that site. An organisation site is defined as a location, or group of locations, used by the organisation that are all within 100 miles (160 kilometres) of each other.
- Worldwide Licence grants an organisation, or agents of an organisation, rights to install and use the software on an unlimited number of devices at an unlimited number of locations used by the organisation, including any cloud-based installations and use performed from those locations. If not listed, please contact us for the worldwide licence price.
- OEM Licence grants an organisation, or agents of an organisation, rights to use and distribute the software with their own hardware or software products. These products must provide substantial additional functionality to this software, and not include any potentially unwanted programs.
Where applicable, additional licence subtypes include:
- Home Licence grants a private individual rights to install and use the software at home, that is in a place of residence, for domestic purposes with no intention to generate income.
- Business Licence grants an organisation (a company, corporation, firm, enterprise or institution, or part thereof) or a person rights to install and use the software in a commercial and non-commercial environment for the purposes of or in connection with running a business, supplying products or services to other organisations or individuals, or generating income.
DISTRIBUTION OF LICENCE KEYS
Except for the specific purposes described in the Grant of Licence and the Licence Types sections, licence keys issued by SoftPerfect may not be distributed by any person, organisation or their agents without written permission from the copyright holder.
MODIFICATIONS
Unauthorised modification, decompilation or reverse engineering of the software or any subset of the software without written permission from the copyright holder is strictly prohibited.
USE
This software is distributed “as is”. No warranty of any kind is expressed or implied. You use it at your own risk. In no event shall SoftPerfect or its agents be liable for any loss or inaccuracy of data, loss or interruption of use, or cost of procuring substitute technology, goods or services, or any other loss or damages. If, despite the foregoing, SoftPerfect is found liable for any damages, its total cumulative liability shall not exceed the amount paid by you for the software licence.
You may not use this software in connection with any illegal, fraudulent, infringing, harmful or offensive activity.
TERMS OF ACCEPTANCE
Installation or use of this software signifies your acceptance of the terms and conditions of the licence. If you do not agree with them, you must stop using and remove the software from your devices. SoftPerfect reserves all rights not expressly granted here. SoftPerfect also reserves the right to terminate this licence immediately if you fail to comply with these terms. Upon termination, you must cease all use of the software and uninstall it from your devices.
GOVERNING LAW AND JURISDICTION
This EULA shall be governed by and construed in accordance with the laws of the State of Queensland, Australia, without regard to its conflict of law principles. The parties agree that the courts of Queensland, Australia, shall have the exclusive jurisdiction to resolve any dispute arising from or in connection with this EULA.